Observability
See how Membrick is working across your project and connected agents. The local dashboard brings memory index health, search activity, and provider activity together in one place.
Dashboard
When the Membrick server is running, open http://127.0.0.1:8080/dashboard.
Start the dashboard
From a Membrick source checkout, start the local server for a project. This example includes Claude Code and Codex provider views:
cargo run --release --bin server --features claude-code,codex -- \
  --project-root /path/to/project \
  --bind 127.0.0.1:8080 \
  --allow-unauthenticated
Replace /path/to/project with the project directory. Then open http://127.0.0.1:8080/dashboard. The server discovers the project's .membrick/ data and the dashboard shows separate provider views when their features are compiled and their integrations have reported activity. See the HTTP server guide for server options and API behavior.
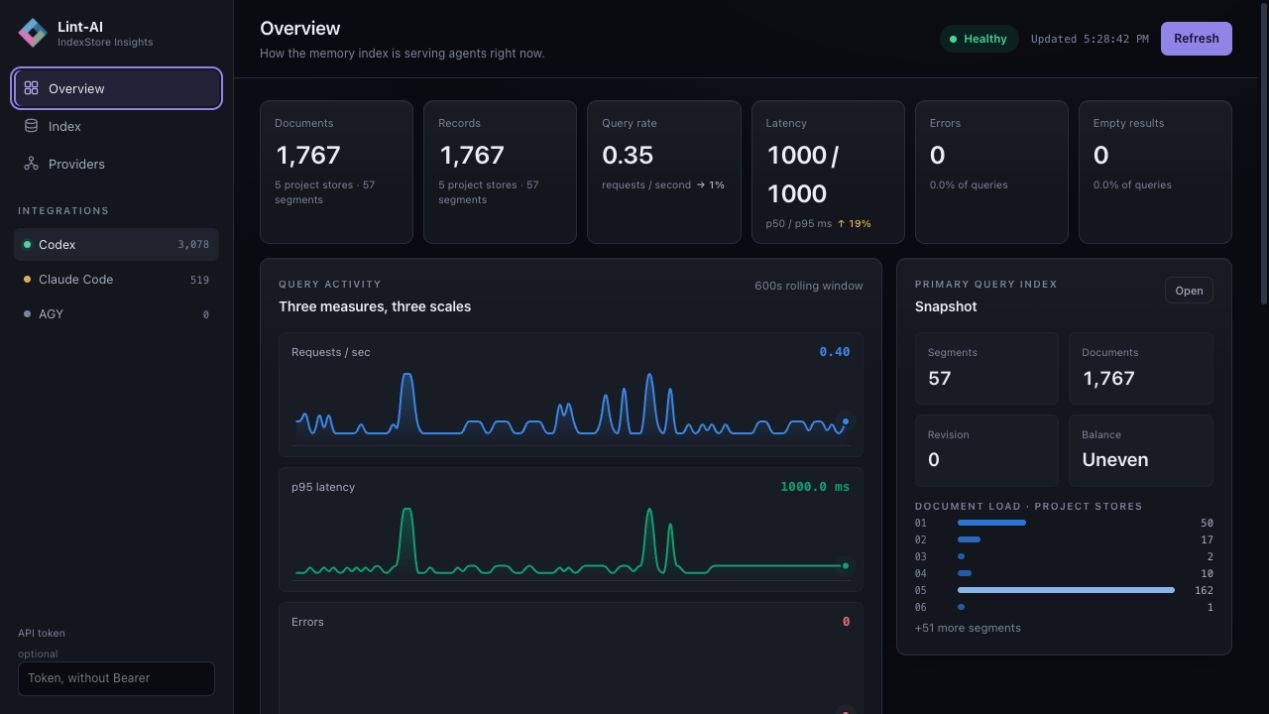
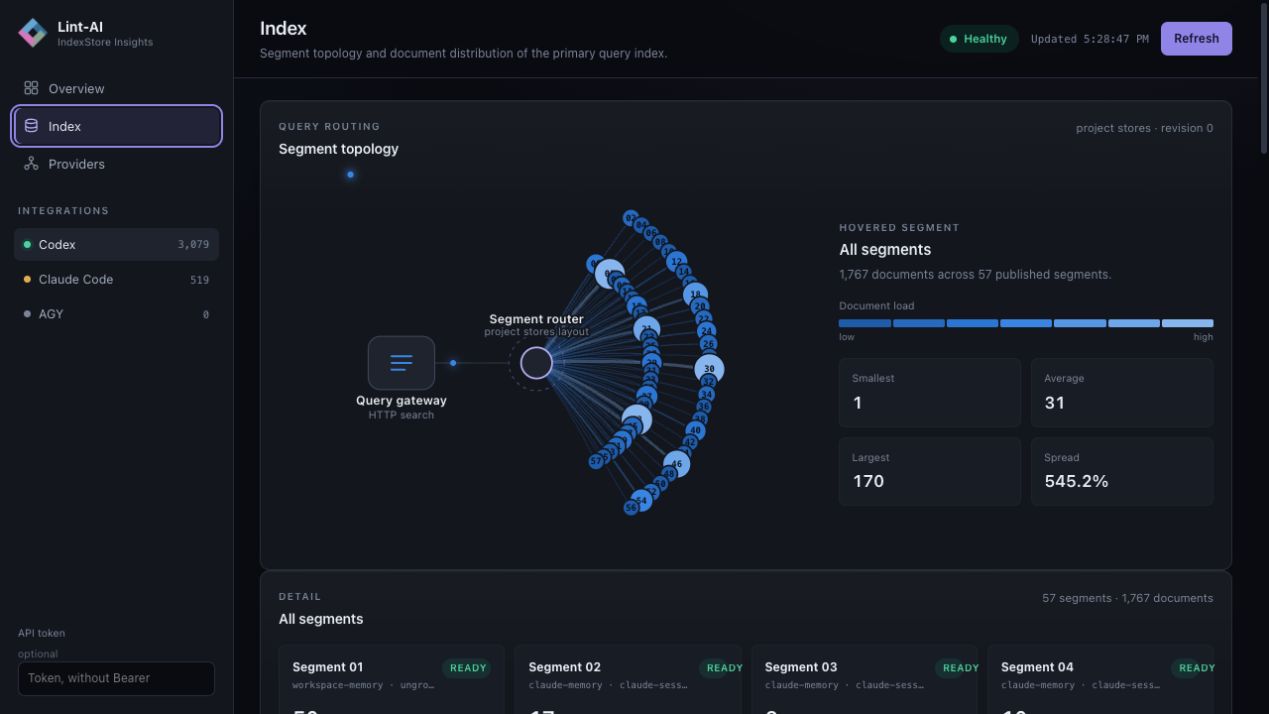
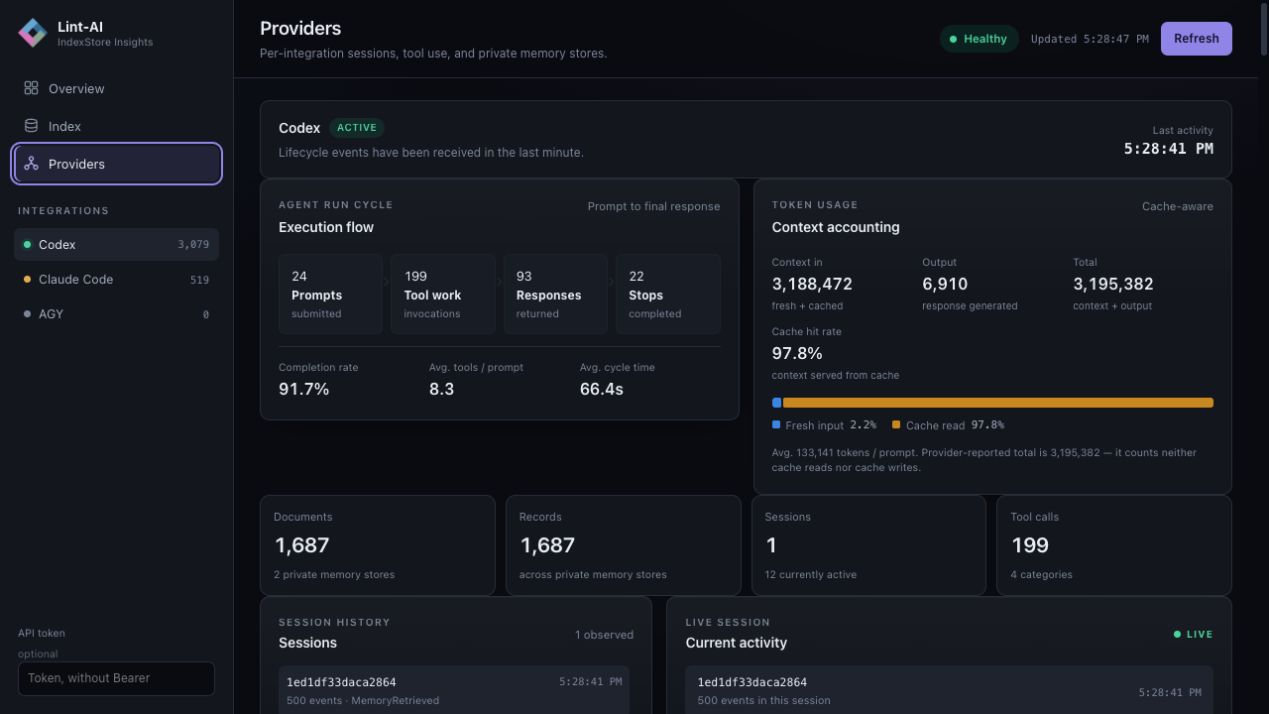
The dashboard refreshes every five seconds. It shows:
- Memory index health: freshness, revisions, and segment counts.
- Search performance: recent request rates, latency, errors, and empty results.
- Agent activity: observed providers, recent sessions, lifecycle events, and tool activity when the connected agent reports it.
- Usage: token counts when available from the agent's hooks or transcripts.
Agent lifecycle and events
An agent lifecycle is the sequence of events while someone uses an agent: a session starts, a prompt arrives, tools run, a turn finishes, and eventually the session ends. The agent host emits these events. Membrick does not poll the agent or invent its own lifecycle events.
When you install an integration, it registers Membrick with the host's hook system. At the appropriate point, the host sends a small event payload to the Membrick hook command or plugin callback. Membrick records a bounded, sanitized event for the dashboard. Some hooks also look up memory or save a useful outcome; many just report that something happened.
sequenceDiagram
    participant U as Person
    participant A as AI agent
    participant H as Agent hook
    participant L as Membrick
    participant D as Dashboard
    U->>A: Start session and send prompt
    A->>H: Emit lifecycle event
    H->>L: Send event payload
    L->>L: Record sanitized event
    L-->>H: Return memory context when this hook retrieves memory
    A->>H: Emit tool and turn events
    H->>L: Send each supported event
    L->>D: Provide recent activity through local API
The event names differ by agent because each host has its own hook system. These are examples of events Membrick can receive:
| Agent | Events Membrick can receive |
|---|---|
| Claude Code | SessionStart, UserPromptSubmit, PreToolUse, PostToolUse, PreCompact, Stop, SessionEnd, and subagent events |
| Codex | SessionStart, UserPromptSubmit, PreToolUse, PostToolUse, PreCompact, PostCompact, Stop, SessionEnd, and subagent events |
| Gemini CLI | SessionStart, BeforeAgent, AfterAgent, BeforeModel, BeforeTool, AfterTool, PreCompress, SessionEnd |
| Antigravity CLI | PreToolUse, PostToolUse, PreInvocation, PostInvocation, Stop |
| OpenClaw | agent:bootstrap, agent_end, before_reset, session_start, session_end, shutdown |
| Muse Code | SessionStart, UserPromptSubmit, tool-use events, Stop, SessionEnd |
| Hermes | Its optional hooks plugin captures memory activity, but does not currently send lifecycle events to this telemetry dashboard. |
For example, a prompt event can trigger a memory lookup, while an end-of-turn event can save an outcome for a later session. The exact hooks that retrieve or save memory vary by agent; the agent lifecycle guide explains those differences.
Lifecycle telemetry is separate from full session recording. It stores bounded event details for the dashboard; it does not copy the full conversation transcript. Session recording is a separate feature for keeping events for replay and inspection. See telemetry details for what is stored and how long it is retained.
Provider state is based on events actually received. An agent may be installed but show no recent activity until its hooks or MCP connection send an event. Token usage also depends on what that agent makes available.
Local data and privacy
Query statistics are bounded and do not store query text, session IDs, or memory content. Provider activity is stored in bounded local ledgers under .membrick/provider-telemetry/; selected events can contain short, redacted previews. Full session recording is a separate feature. See telemetry details for coverage, retention, and file-watcher behavior.
The dashboard itself is read-only. Its page can load before you enter an API token, while its data endpoints use the server's configured authentication. Keep the server on localhost as described in the HTTP server guide.
Metrics and integrations
The server also exposes aggregate metrics for monitoring tools:
| Endpoint | What it reports |
|---|---|
GET /api/status | Index state, query summary, and integration status |
GET /api/timeseries | Recent query counts and latency summaries |
GET /api/integrations | Provider readiness and observed state |
GET /api/sessions and GET /api/events | Recent sanitized provider activity |
GET /api/metrics | Machine-readable JSON metrics |
GET /metrics | Prometheus-format metrics |
The same query, agent activity, and memory index summaries are available to Prometheus through GET /metrics. See Prometheus for scrape configuration, the metric list, and which dashboard details stay in the event view. Membrick exposes Prometheus metrics today; it does not currently export OpenTelemetry OTLP data.
See the server setup to start the dashboard, and telemetry details for event coverage and data handling.